


A Look at the WSR-88D Doppler Radar System |
Overview:
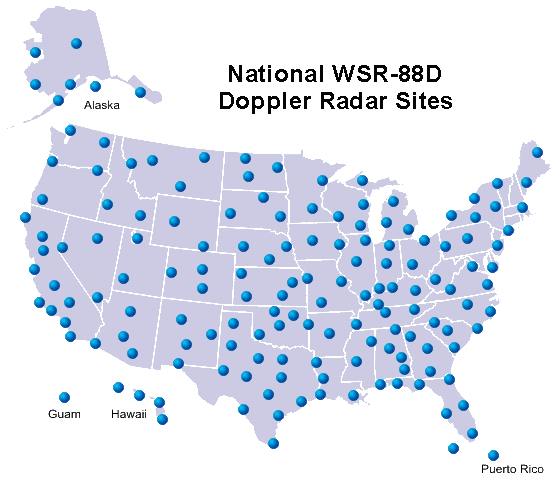
The National Weather Service's (NWS) Weather Surveillance Doppler Radar (WSR-88D) is a highly sensitive, powerful, and invaluable technology. Key components of the system include the Radar Data Acquisition (RDA) (i.e., the antenna) and the Radar Products Generator (RPG) which generate a multitude of radar data for display on the Advanced Weather Interactive Processing System (AWIPS) workstations. The WSR-88D shows the location, intensity, and movement of precipitation, ranging from light snow flurries to very heavy rain and large hail. From movement of precipitation, the WSR-88D also can sense motion (i.e., velocity) in the atmosphere directed toward and away from the radar. Velocity data helps in assessing atmospheric wind fields, as well as severe weather velocity signatures from thunderstorms. The WSR-88D system contains various software algorithms as well that produce a number of other radar products and alarms when threshold values of certain parameters are met. The radar also can communicate with other WSR-88D systems via dial-up capabilities. The WSR-88D greatly enhances the ability of NWS forecasters to issue short-term forecasts for any weather situation, as well as timely and accurate warnings during severe thunderstorm events. Forecasters undergo in-depth training in order to become highly proficient with the radar and to properly interpret severe weather radar signatures. Data available from the WSR-88D allows NWS meteorologists to thoroughly dissect and evaluate thunderstorms and their trends, all of which are extremely helpful in the warning decision process. Accurate spotter reports also are critical to assist in the analysis process and to verify radar signatures. WSR-88D pictures and example data fields are available on the NWS Louisville Science and Technology page. Also available are WSR-88D radar imagery from selective severe weather events in Kentucky and southern Indiana. The map below shows locations of WSR-88D radars across the United States.
 Several of the important WSR-88D products available to NWS forecasters include:
Base Reflectivity:
Used extensively to identify the location, intensity, pattern, and movement of precipitation, including light snow flurries to heavy rain and hail producing thunderstorms. Reflectivity data provide a wealth of crucial information needed to issue accurate severe weather warnings. High reflectivity values denote that heavy rain and possibly hail are occurring within thunderstorms. The radar generates reflectivity data at various altitudes, which permits an evaluation of thunderstorms in the lower, middle, and upper portions of the storms in order to determine their vertical structure. In winter storms, reflectivity data clearly can slow banded precipitation, including snow that can lead to narrow zones of heavier snowfall amounts.
Composite Reflectivity:
A plan view display of maximum reflectivity values associated with any portion of (altitude within) a thunderstorm. This product provides a quick reference as to the life cycle stage of various storms, their relative strength, and their potential for hail.
Layer Maximum Reflectivity:
Provides maximum reflectivity values within discrete layers of the atmosphere. This product permits assessment of the middle and upper portions of thunderstorms, and is another important tool to determine hail and damaging downburst wind potential.
Base (Ground-Relative) Velocity:
Measures atmospheric wind fields directed toward and away from the radar (i.e., "radial" winds). Base velocity is important for detecting potential straight-line wind damage from thunderstorms, as well as overall wind flow patterns in the atmosphere. To better conceptualize ground-relative velocity, consider this example: if a person stood outside and did not move, the wind velocity that person felt would be "base" or "ground-relative," i.e., the actual wind in the atmosphere. Single Doppler radar only can assess wind components directed toward and away from the radar. However, from these radial winds, actual wind patterns often can be deduced.
Storm-Relative Velocity:
Measures winds relative to a moving precipitation entity (e.g., a thunderstorm). In other words, it is the wind that a thunderstorm actually "feels" as it moves through the environment. It is calculated by subtracting out the motion of the storm from the actual wind. Storm-relative velocity is critical for detecting shear zones and circulations/mesocyclones within severe thunderstorms that could result in damaging surface winds, hail, and even tornadoes. Converging and diverging wind fields can be detected using storm-relative data as well, which also have important implications on the structure and evolution of thunderstorms and their potential severity. To better conceptualize storm-relative velocity, consider this example: if a person rode a bike outside (i.e., was moving), the wind velocity that person felt while moving would be "storm-relative" or "system-relative" (combines the actual wind with the movement of the person), i.e., different from the actual or "ground-relative" wind. Red colors are radial winds directed away from the radar site whereas Green colors are radial winds directed towards from the radar site.
Reflectivity and Velocity Vertical Cross-Sections:
Allows forecasters to assess the vertical structure of thunderstorms. Critical factors that can be analyzed include the echo top height, storm tilt, height and depth of high reflectivity values, height and depth of circulations/mesocyclones (i.e., rotating updraft) within a thunderstorm, airflow patterns within and near a storm, and the life cycle stage of a storm.
Vertically Integrated Liquid (VIL):
A vertical integration of reflectivity values within the entire depth of thunderstorms, i.e., a type of measure of the amount of liquid and ice within storms. This parameter allows forecasters to monitor storm severity trends as well as the potential for large hail.
Precipitation Estimates (1-hour; 3-hour; storm total):
The radar estimates precipitation amounts for 1-hour and 3-hour periods, as well as a storm/weather system total. As an augment to ground-truth rain gauges, these radar products are crucial in determining the potential for flooding and flash flooding from precipitating weather systems, especially thunderstorms. There are a few accuracy limitations to these products, but overall the radar usually does a very good job in determining amounts and locations of precipitation.
Velocity Azimuth Display (VAD) Wind Profile (VWP):
A radar estimation of wind speeds at specific altitudes in the atmosphere as a function of time. The VWP product allows forecasters to assess vertical wind shear (speed and directional shear) in the environment, which is crucial to the organization and severity potential of thunderstorms, assuming sufficient moisture, instability, and lift are present to form storms. Vertical speed shear refers to increasing wind speeds with height. Directional shear refers to a change in wind direction with height.
Numerous other products and product overlays are available on the WSR-88D. The combination of extensive forecaster training, an excellent radar system (the NWS's WSR-88D), and spotter reports are allowing severe storms to be detected, evaluated, and warned for better than in the past. Some thunderstorms evolve and move very quickly; thus, timely warnings may not always be possible for every storm. However, the new training and technology certainly will continue to have a tremendous positive impact on the NWS's ability to issue timely and accurate warnings. The NWS Louisville staff uses this technology every day.
The National Weather Service's (NWS) Weather Surveillance Doppler Radar (WSR-88D) is a highly sensitive, powerful, and invaluable technology. Key components of the system include the Radar Data Acquisition (RDA) (i.e., the antenna) and the Radar Products Generator (RPG) which generate a multitude of radar data for display on the Advanced Weather Interactive Processing System (AWIPS) workstations. The WSR-88D shows the location, intensity, and movement of precipitation, ranging from light snow flurries to very heavy rain and large hail. From movement of precipitation, the WSR-88D also can sense motion (i.e., velocity) in the atmosphere directed toward and away from the radar. Velocity data helps in assessing atmospheric wind fields, as well as severe weather velocity signatures from thunderstorms. The WSR-88D system contains various software algorithms as well that produce a number of other radar products and alarms when threshold values of certain parameters are met. The radar also can communicate with other WSR-88D systems via dial-up capabilities. The WSR-88D greatly enhances the ability of NWS forecasters to issue short-term forecasts for any weather situation, as well as timely and accurate warnings during severe thunderstorm events. Forecasters undergo in-depth training in order to become highly proficient with the radar and to properly interpret severe weather radar signatures. Data available from the WSR-88D allows NWS meteorologists to thoroughly dissect and evaluate thunderstorms and their trends, all of which are extremely helpful in the warning decision process. Accurate spotter reports also are critical to assist in the analysis process and to verify radar signatures. WSR-88D pictures and example data fields are available on the NWS Louisville Science and Technology page. Also available are WSR-88D radar imagery from selective severe weather events in Kentucky and southern Indiana. The map below shows locations of WSR-88D radars across the United States.
Base Reflectivity:
Used extensively to identify the location, intensity, pattern, and movement of precipitation, including light snow flurries to heavy rain and hail producing thunderstorms. Reflectivity data provide a wealth of crucial information needed to issue accurate severe weather warnings. High reflectivity values denote that heavy rain and possibly hail are occurring within thunderstorms. The radar generates reflectivity data at various altitudes, which permits an evaluation of thunderstorms in the lower, middle, and upper portions of the storms in order to determine their vertical structure. In winter storms, reflectivity data clearly can slow banded precipitation, including snow that can lead to narrow zones of heavier snowfall amounts.
Composite Reflectivity:
A plan view display of maximum reflectivity values associated with any portion of (altitude within) a thunderstorm. This product provides a quick reference as to the life cycle stage of various storms, their relative strength, and their potential for hail.
Layer Maximum Reflectivity:
Provides maximum reflectivity values within discrete layers of the atmosphere. This product permits assessment of the middle and upper portions of thunderstorms, and is another important tool to determine hail and damaging downburst wind potential.
Base (Ground-Relative) Velocity:
Measures atmospheric wind fields directed toward and away from the radar (i.e., "radial" winds). Base velocity is important for detecting potential straight-line wind damage from thunderstorms, as well as overall wind flow patterns in the atmosphere. To better conceptualize ground-relative velocity, consider this example: if a person stood outside and did not move, the wind velocity that person felt would be "base" or "ground-relative," i.e., the actual wind in the atmosphere. Single Doppler radar only can assess wind components directed toward and away from the radar. However, from these radial winds, actual wind patterns often can be deduced.
Storm-Relative Velocity:
Measures winds relative to a moving precipitation entity (e.g., a thunderstorm). In other words, it is the wind that a thunderstorm actually "feels" as it moves through the environment. It is calculated by subtracting out the motion of the storm from the actual wind. Storm-relative velocity is critical for detecting shear zones and circulations/mesocyclones within severe thunderstorms that could result in damaging surface winds, hail, and even tornadoes. Converging and diverging wind fields can be detected using storm-relative data as well, which also have important implications on the structure and evolution of thunderstorms and their potential severity. To better conceptualize storm-relative velocity, consider this example: if a person rode a bike outside (i.e., was moving), the wind velocity that person felt while moving would be "storm-relative" or "system-relative" (combines the actual wind with the movement of the person), i.e., different from the actual or "ground-relative" wind. Red colors are radial winds directed away from the radar site whereas Green colors are radial winds directed towards from the radar site.
Reflectivity and Velocity Vertical Cross-Sections:
Allows forecasters to assess the vertical structure of thunderstorms. Critical factors that can be analyzed include the echo top height, storm tilt, height and depth of high reflectivity values, height and depth of circulations/mesocyclones (i.e., rotating updraft) within a thunderstorm, airflow patterns within and near a storm, and the life cycle stage of a storm.
Vertically Integrated Liquid (VIL):
A vertical integration of reflectivity values within the entire depth of thunderstorms, i.e., a type of measure of the amount of liquid and ice within storms. This parameter allows forecasters to monitor storm severity trends as well as the potential for large hail.
Precipitation Estimates (1-hour; 3-hour; storm total):
The radar estimates precipitation amounts for 1-hour and 3-hour periods, as well as a storm/weather system total. As an augment to ground-truth rain gauges, these radar products are crucial in determining the potential for flooding and flash flooding from precipitating weather systems, especially thunderstorms. There are a few accuracy limitations to these products, but overall the radar usually does a very good job in determining amounts and locations of precipitation.
Velocity Azimuth Display (VAD) Wind Profile (VWP):
A radar estimation of wind speeds at specific altitudes in the atmosphere as a function of time. The VWP product allows forecasters to assess vertical wind shear (speed and directional shear) in the environment, which is crucial to the organization and severity potential of thunderstorms, assuming sufficient moisture, instability, and lift are present to form storms. Vertical speed shear refers to increasing wind speeds with height. Directional shear refers to a change in wind direction with height.
Numerous other products and product overlays are available on the WSR-88D. The combination of extensive forecaster training, an excellent radar system (the NWS's WSR-88D), and spotter reports are allowing severe storms to be detected, evaluated, and warned for better than in the past. Some thunderstorms evolve and move very quickly; thus, timely warnings may not always be possible for every storm. However, the new training and technology certainly will continue to have a tremendous positive impact on the NWS's ability to issue timely and accurate warnings. The NWS Louisville staff uses this technology every day.

