


Composite Reflectivity Explained |
 The strongest returned energy for each elevation angle in a volume scan is compiled into one image called, simply, composite
reflectivity. Whereas the base reflectivity image is the first image available during a volume scan, the composite reflectivity
image is one of the last views necessitated by the need for all elevation scans to be completed before this image can be
produced.
The strongest returned energy for each elevation angle in a volume scan is compiled into one image called, simply, composite
reflectivity. Whereas the base reflectivity image is the first image available during a volume scan, the composite reflectivity
image is one of the last views necessitated by the need for all elevation scans to be completed before this image can be
produced.Therein lies an important point when viewing composite reflectivity images; always check the time of the image. Often, the base reflectivity image and composite reflectivity image will not have the same time with the base reflectivity image being the most recent.
When compared with Base Reflectivity, the Composite Reflectivity can reveal important storm structure features and intensity trends of storms. This is important because often during the development of strong to severe thunderstorms, rain-free areas (or areas with light rain) develop as a result of strong updrafts.
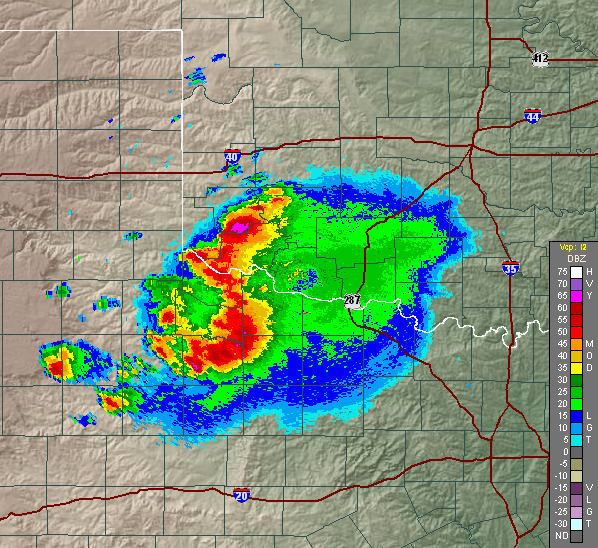
As you "mouseover" the composite image (above) it will change to the base reflectivity image from the same time as the composite view. The first thing you will notice about the composite image is there is much more "green" color near the radar, located at the center.
When higher elevation scan information is included in the composite reflectivity, it appears to indicate more widespread rain. However, the base reflectivity images does not show that rain so it is probably not reaching the ground but evaporating as it falls from very high in the atmosphere.
The composite reflectivity radar shows the maximum dBZ in a given vertical column for all columns in the radar's range. Consequently, it gives a plan view of the most intense portions of a precipitating system regardless of its altitude. Composite reflectivity is very useful for noting heavy precipitation cores at mid-levels and for viewing the areal extent of precipitation at middle and upper levels. However, some of this precipitation may evaporate before it reaches the ground. To correctly use composite reflectivity you need to understand weather radar scanning geometry and also the typical structure of the observed phenomenon.
Evidence of very strong updrafts (leading to the possibility of severe weather) can be seen when comparing the two images. At #1, the fuschia colored region, visible on the composite image, is all but missing on the base reflectivity.
Using the color scale, this area is at 65 dBZ on the composite image. This is an area of concern as this is probably hail that has yet to fall. Remember the old adage "What goes up, must come down". Some or most of the hail may melt before reaching the ground but at the very least, intense, blinding rain may be about to occur near this location.
The notches, at #2 and #3, show more rain supported by strong updrafts. Those locations require additional interrogation to determine what is taking place at these locations which will come from the velocity products.
Note: caution when interpreting any radar image. No single image (or combination of images) from the NWS Doppler radar will provide the whole picture of the weather occurring in your area. Also, these images are a picture of what HAS happened and not what IS happening, as there will be a delay in the time the image was created and the time it is made available on the Internet. Always check the time of each image.

