


Weather Fronts Explained |
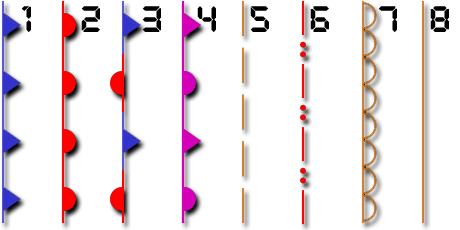
| 1. Cold Front | 3. Stationary Front | 5. Surface Trough | 7. Dry Line | |||
| 2. Warm Front | 4. Occluded Front | 6. Squall Line | 8. Tropical Wave | |||
Blue spikes indicate COLD fronts. Red half circles indicate WARM fronts. Both the warm and cold front indicators indicate the direction of travel for that front. Indicators alternating on both sides of the line, indicate a stalled or stationary front. |
||||||
| Cold Front | ||
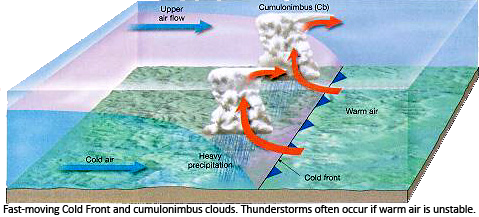 A cold front is located at the leading edge of the temperature drop off, which in an isotherm analysis shows up as the leading edge of the isotherm gradient, and it normally lies within a
sharp surface trough. Cold fronts can move up to twice as fast and produce sharper changes in weather than warm fronts, since cold air is denser than warm air and rapidly replaces the warm
air preceding the boundary. On weather maps, the surface position of the cold front is marked with the symbol of a blue line of triangle-shaped pips pointing in the direction of travel, and
it is placed at the leading edge of the cooler air mass. Cold fronts come in association with a low pressure area. When a cold front moves through, the air with greater density wedges under
the less dense warmer air, lifting it, which can cause the formation of a narrow line of showers and thunderstorms when enough moisture is present. This upward motion causes lowered pressure
along the cold front.
A cold front is located at the leading edge of the temperature drop off, which in an isotherm analysis shows up as the leading edge of the isotherm gradient, and it normally lies within a
sharp surface trough. Cold fronts can move up to twice as fast and produce sharper changes in weather than warm fronts, since cold air is denser than warm air and rapidly replaces the warm
air preceding the boundary. On weather maps, the surface position of the cold front is marked with the symbol of a blue line of triangle-shaped pips pointing in the direction of travel, and
it is placed at the leading edge of the cooler air mass. Cold fronts come in association with a low pressure area. When a cold front moves through, the air with greater density wedges under
the less dense warmer air, lifting it, which can cause the formation of a narrow line of showers and thunderstorms when enough moisture is present. This upward motion causes lowered pressure
along the cold front.| Warm Front | ||
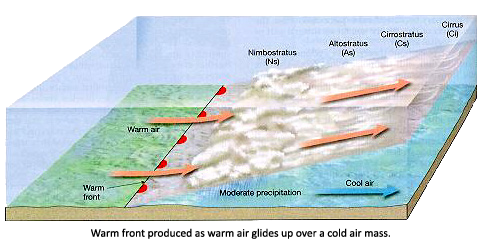 Warm fronts are at the leading edge of a homogeneous warm air mass, which is located on the equatorward edge of the gradient in isotherms, and lie within broader troughs of low pressure than
cold fronts. A warm front moves more slowly than the cold front which usually follows because cold air is denser and harder to remove from the earth's surface. This also forces temperature
differences across warm fronts to be broader in scale. Clouds ahead of the warm front are mostly stratiform, and rainfall gradually increases as the front approaches. Fog can also occur
preceding a warm frontal passage. Clearing and warming is usually rapid after frontal passage. If the warm air mass is unstable, thunderstorms may be embedded among the stratiform clouds
ahead of the front, and after frontal passage thundershowers may continue. On weather maps, the surface location of a warm front is marked with a red line of semi-circles pointing in the
direction of travel.
Warm fronts are at the leading edge of a homogeneous warm air mass, which is located on the equatorward edge of the gradient in isotherms, and lie within broader troughs of low pressure than
cold fronts. A warm front moves more slowly than the cold front which usually follows because cold air is denser and harder to remove from the earth's surface. This also forces temperature
differences across warm fronts to be broader in scale. Clouds ahead of the warm front are mostly stratiform, and rainfall gradually increases as the front approaches. Fog can also occur
preceding a warm frontal passage. Clearing and warming is usually rapid after frontal passage. If the warm air mass is unstable, thunderstorms may be embedded among the stratiform clouds
ahead of the front, and after frontal passage thundershowers may continue. On weather maps, the surface location of a warm front is marked with a red line of semi-circles pointing in the
direction of travel.| Stationary Front and Shearline | ||
| A stationary front is a non-moving (or stalled) boundary between two air masses, neither of which is strong enough to replace the other. They tend to remain
essentially in the same area for extended periods of time, usually moving in waves. There is normally a broad temperature gradient behind the boundary with
more widely spaced isotherm packing. Stationary fronts are marked on weather maps with alternating red half-circles and blue spikes pointing in opposite directions, indicating no significant movement. In the example to the left the warm front, indicated by the red half circles, would be pushing east whereas the cold front, indicated by the blue spikes, would be pushing west. A wide variety of weather can be found along a stationary front, but usually clouds and prolonged precipitation are found there. Stationary fronts either dissipate after several days or devolve into shear lines, but they can transform into a cold or warm front if conditions aloft change causing the stronger of the two fronts to win out or the stationary front will be pushed in one direction by another stronger front pushing behind it. When stationary fronts become smaller in scale, degenerating to a narrow zone where wind direction changes significantly over a relatively short distance, they become known as shearlines. A shearline is depicted as a line of red dots and dashes. |
| Occluded Front | ||
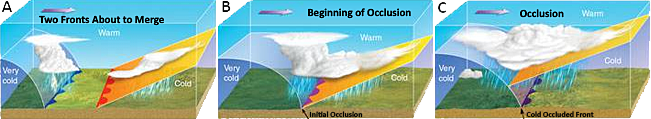
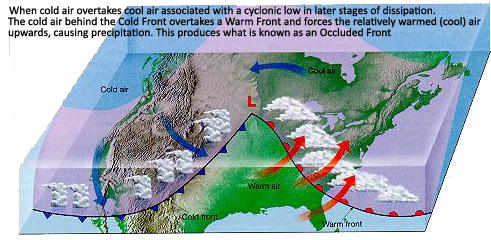 There are two types of occlusions, the warm, and the cold. In a cold occlusion, the air mass overtaking the warm front is cooler than the cool air ahead of the warm
front, and plows under both air masses. In a warm occlusion, the air mass overtaking the warm front is not as cool as the cold air ahead of the warm front, and rides
over the colder air mass while lifting the warm air.
There are two types of occlusions, the warm, and the cold. In a cold occlusion, the air mass overtaking the warm front is cooler than the cool air ahead of the warm
front, and plows under both air masses. In a warm occlusion, the air mass overtaking the warm front is not as cool as the cold air ahead of the warm front, and rides
over the colder air mass while lifting the warm air.Being more detailed: An occluded front is formed when a cold front overtakes a warm front. The cold and warm fronts curve naturally poleward into the point of occlusion, which is also known as the triple point. It lies within a sharp trough, but the air mass behind the boundary can be either warm or cold. In a cold occlusion, the air mass overtaking the warm front is cooler than the cool air ahead of the warm front and plows under both air masses. In a warm occlusion, the air mass overtaking the warm front is warmer than the cold air ahead of the warm front and rides over the colder air mass while lifting the warm air. As the storm intensifies, the cold front rotates around the storm and catches the warm front. This forms an occluded front, which is the boundary that separates the new cold air mass (to the west) from the older cool air mass already in place north of the warm front. Both types of fronts are usually associated with rain or snow and cumulus clouds. Temperature fluctuations generally are small and a noticeable wind shift also occurrs across the occluded front. East of the front, winds were reported from the east-southeast while behind the front, winds were from the west-southwest.
 A wide variety of weather can be found along an occluded front, with thunderstorms possible, but usually their passage is associated with a drying of the air mass.
Occluded fronts are indicated on a weather map by a pinkish-purple line with alternating half-circles and triangles pointing in direction of travel. Occluded fronts
usually form around mature low-pressure areas almost always to the north where the two fronts meet. They are easily identified by the northwestward (counterclockwise)
rotation on visible satellite maps.
A wide variety of weather can be found along an occluded front, with thunderstorms possible, but usually their passage is associated with a drying of the air mass.
Occluded fronts are indicated on a weather map by a pinkish-purple line with alternating half-circles and triangles pointing in direction of travel. Occluded fronts
usually form around mature low-pressure areas almost always to the north where the two fronts meet. They are easily identified by the northwestward (counterclockwise)
rotation on visible satellite maps.| Troughs | ||
Definition: A trough is an elongated region of relatively low atmospheric pressure, often associated with fronts.
 Unlike fronts, there is not a universal symbol for a trough on a weather chart. In the United States, a trough may be marked as a dashed line. If it is not marked,
troughs may still be identified as an extension of isobars away from a low pressure center. The weather charts in some countries or regions mark troughs by a line.
In Hong Kong or Fiji, it is represented by a bold line extended from a low pressure center or between two low pressure centers; in Macau or Australia, it is a
dotted line.
Unlike fronts, there is not a universal symbol for a trough on a weather chart. In the United States, a trough may be marked as a dashed line. If it is not marked,
troughs may still be identified as an extension of isobars away from a low pressure center. The weather charts in some countries or regions mark troughs by a line.
In Hong Kong or Fiji, it is represented by a bold line extended from a low pressure center or between two low pressure centers; in Macau or Australia, it is a
dotted line.
Sometimes, the region between two high pressure centers may assume the character of a trough when there is a detectable wind shift noted at the surface. In the absence of a wind shift, the region is designated a col (a region of lower air pressure between two high pressure areas), akin to a geographic saddle between two mountain peaks.
If a trough forms in the mid-latitudes, a temperature difference between two sides of the trough usually exists in the form of a weather front. A weather front is usually less convective than a trough in the tropics or subtropics (such as a tropical wave). Sometimes, collapsed frontal systems will degenerate into troughs.
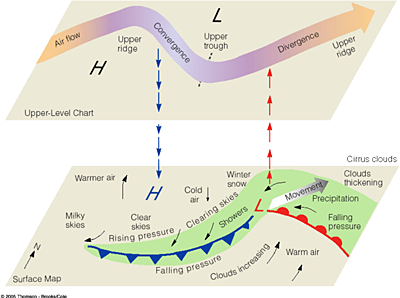
Convective cells (a phenomenon of fluid dynamics that occurs in situations where there are temperature differences within a body of liquid or gas) may develop in the vicinity of troughs and gives birth to a tropical cyclone. Some tropical or subtropical regions such as the Philippines or south China are greatly affected by convection cells along a trough. In the mid-latitude westerlies, troughs and ridges often alternate, especially when upper-level winds are in a high-amplitude pattern. For a trough in the westerlies, the region just west of the trough axis is typically an area of convergent winds and descending air - and hence high pressure - while the region just east of the trough axis is an area of fast, divergent winds and low pressure. Tropical waves are a type of trough in easterly currents, a cyclonic northward deflection of the trade winds.
TYPES OF TROUGHS
In addition to standard troughs, some may be described further with a qualifying term indicating a specific or a set of characteristics:
Unlike fronts, there is not a universal symbol for a trough on a weather chart. In the United States, a trough may be marked as a dashed line. If it is not marked,
troughs may still be identified as an extension of isobars away from a low pressure center. The weather charts in some countries or regions mark troughs by a line.
In Hong Kong or Fiji, it is represented by a bold line extended from a low pressure center or between two low pressure centers; in Macau or Australia, it is a
dotted line.Sometimes, the region between two high pressure centers may assume the character of a trough when there is a detectable wind shift noted at the surface. In the absence of a wind shift, the region is designated a col (a region of lower air pressure between two high pressure areas), akin to a geographic saddle between two mountain peaks.
If a trough forms in the mid-latitudes, a temperature difference between two sides of the trough usually exists in the form of a weather front. A weather front is usually less convective than a trough in the tropics or subtropics (such as a tropical wave). Sometimes, collapsed frontal systems will degenerate into troughs.
Convective cells (a phenomenon of fluid dynamics that occurs in situations where there are temperature differences within a body of liquid or gas) may develop in the vicinity of troughs and gives birth to a tropical cyclone. Some tropical or subtropical regions such as the Philippines or south China are greatly affected by convection cells along a trough. In the mid-latitude westerlies, troughs and ridges often alternate, especially when upper-level winds are in a high-amplitude pattern. For a trough in the westerlies, the region just west of the trough axis is typically an area of convergent winds and descending air - and hence high pressure - while the region just east of the trough axis is an area of fast, divergent winds and low pressure. Tropical waves are a type of trough in easterly currents, a cyclonic northward deflection of the trade winds.
TYPES OF TROUGHS
In addition to standard troughs, some may be described further with a qualifying term indicating a specific or a set of characteristics:
- Lee Trough
- A "lee trough" is one and the same thing as a "dynamic trough." According to the American Meteorological Society Glossary, it is a pressure trough formed on the lee side of a mountain range (the side that is sheltered from the wind) in situations where the wind is blowing with a substantial component across the mountain ridge; often seen on United States weather maps east of the Rocky Mountains, and sometimes east of the Appalachians, where it is less pronounced, and can be formed either as a result of the adiabatic compression of sinking air on the lee side of a mountain range, or through cyclogenesis resulting from the horizontal convergence associated with vertical stretching of air columns passing over the ridge and descending the lee slope.
- Inverted Trough
- An Inverted Trough is oriented opposite to the usual orientation of mid-latitude troughs. The most common type of inverted trough is the tropical wave.
- Thermal Trough
- A thermal trough is a trough formed by intense heating, usually in an enclosed valley such as California's Central Valley. This trough in some ways resembles and functions like a monsoon, drawing in marine air which however, in the case of California, is too stable to produce thunderstorms on the Pacific side. The thermal trough here may however interact with the Southwest Monsoon and draw thunderstorms up along the east side of the Sierra Nevada.
| Squall Line | ||
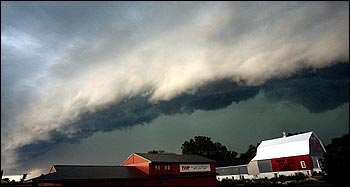 A shelf cloud such as the one shown to the left can be a sign that a squall is imminent. Organized areas of thunderstorm activity not only reinforce pre-existing
frontal zones, but can outrun cold fronts in a pattern where the upper level jet splits apart into two streams, with the resultant Mesoscale Convective System
(MCS) forming at the point of the upper level split in the wind pattern running southeast into the warm sector parallel to low-level thickness lines. When the
convection is strong and linear or curved, the MCS is called a squall line, with the feature placed at the leading edge of the significant wind shift and pressure
rise. Even weaker and less organized areas of thunderstorms lead to locally cooler air and higher pressures, and outflow boundaries exist ahead of this type of
activity, which can act as foci for additional thunderstorm activity later in the day.
A shelf cloud such as the one shown to the left can be a sign that a squall is imminent. Organized areas of thunderstorm activity not only reinforce pre-existing
frontal zones, but can outrun cold fronts in a pattern where the upper level jet splits apart into two streams, with the resultant Mesoscale Convective System
(MCS) forming at the point of the upper level split in the wind pattern running southeast into the warm sector parallel to low-level thickness lines. When the
convection is strong and linear or curved, the MCS is called a squall line, with the feature placed at the leading edge of the significant wind shift and pressure
rise. Even weaker and less organized areas of thunderstorms lead to locally cooler air and higher pressures, and outflow boundaries exist ahead of this type of
activity, which can act as foci for additional thunderstorm activity later in the day.These features are often depicted in the warm season across the United States on surface analysis and lie within surface troughs. If outflow boundaries or squall lines form over arid regions, a haboob may result. Squall lines are depicted on NWS surface analysis as an alternating pattern of two red dots and a dash labeled SQLN or SQUALL LINE, while outflow boundaries are depicted as troughs with a label of OUTFLOW BNDRY.
| Dry Line | ||
A similar phenomenon to a weather front is the dry line (also called dew point line, or Marfa front), which is the boundary between air masses with significant
moisture differences. When westerly winds aloft increase on the north side of surface highs, areas of lowered pressure will form downwind of a north south
oriented mountain chains, leading to the formation of a lee trough. Near the surface during daylight hours, warm moist air is denser than dry air of greater
temperature, and thus the warm moist air wedges under the drier air like a cold front. At higher altitudes, the warm moist air is less dense than the dry air
and the boundary slope reverses. In the vicinity of the reversal aloft, severe weather is possible, especially when a triple point is formed with a cold front.
A weaker form of the dry line seen more commonly is the lee trough, which displays weaker differences in moisture. When moisture pools along the boundary during
the warm season, it can be the focus of diurnal thunderstorms.
The dry line may occur anywhere on earth in regions intermediate between desert areas and warm seas. The southern plains west of the Mississippi River in the United States are a particularly favored location. The dry line normally moves eastward during the day and westward at night. A dry line is depicted on National Weather Service (NWS) surface analysis as a orange line with scallops facing into the moist sector. Dry lines are one of the few surface fronts where the pips indicated do not necessarily reflect the direction of motion.
The dry line may occur anywhere on earth in regions intermediate between desert areas and warm seas. The southern plains west of the Mississippi River in the United States are a particularly favored location. The dry line normally moves eastward during the day and westward at night. A dry line is depicted on National Weather Service (NWS) surface analysis as a orange line with scallops facing into the moist sector. Dry lines are one of the few surface fronts where the pips indicated do not necessarily reflect the direction of motion.
| Tropical Waves | ||
Atlantic tropical waves develop from disturbances which drift off the continent of Africa onto the Atlantic Ocean. They are generated or enhanced by the African
Easterly Jet. The clockwise circulation of the large transoceanic high-pressure cell or anticyclone centered near the Azores islands moves easterly waves away
from the coastal areas of Africa towards North America. Tropical waves cause approximately 60% of Atlantic tropical cyclones and 85% of intense Atlantic
hurricanes (Category 3 and greater).
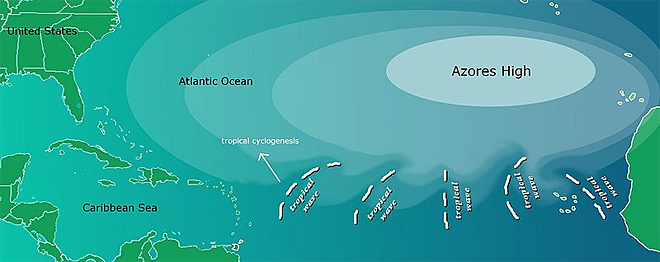
Tropical cyclones sometimes degenerate back into a tropical wave. This normally occurs if upper-level wind shear is too strong. The storm can redevelop if the upper level shear abates. If a tropical wave is moving quickly, it can have strong winds of over tropical storm force but is not considered a tropical storm unless it has a closed circulation. An example of this was Hurricane Claudette in 2003, where the original wave had winds of 45 mph (72 km/h) before developing a circulation. Tropical waves are depicted with a solid orange line on the U.S. National Weather Service Unified Surface Analysis.
Tropical cyclones sometimes degenerate back into a tropical wave. This normally occurs if upper-level wind shear is too strong. The storm can redevelop if the upper level shear abates. If a tropical wave is moving quickly, it can have strong winds of over tropical storm force but is not considered a tropical storm unless it has a closed circulation. An example of this was Hurricane Claudette in 2003, where the original wave had winds of 45 mph (72 km/h) before developing a circulation. Tropical waves are depicted with a solid orange line on the U.S. National Weather Service Unified Surface Analysis.

